Below I make available my own collection of different data concerning the period of the People's Poland in relation to the current period, any for the pre-war period and any data on the current situation.
Entry updated with fresh content.
Nominal economy size:
1970: 18th place in the world
2013: 21st place in the world
Fertility factor:
up to 1990: above 2.1
from 1997: below 1
Level of illiteracy [%]:
1921: 33,1
1931: 23.1
1960: 2,7
1978: 1,2
Index of social inequality (Gini coefficient):
1988: 24
2014: 34
Production of cow's milk [mold l]:
1989: 16
2016: 11
Production of butter [000 t]:
1988: 264
2016: 188
Meat consumption per year [kg/person]:
1970: 53
1980: 78
2014: 74
Manufacture of footwear [million pairs]:
1988: 65.6
2007: 24
2014: 36.4
Number of milk bars:
'60s: 40,000."
1979: 429
1984: 359
2009: 120
* most likely all places of collective nutrition
Number of nurseries:
1989: 1553
2006: 371
2016: 2250 (c. 74.6% private)
Number of public libraries:
1989: 10 269
2016: 7 984
Number of library points:
1989: 22 091
2015: 1 295
Number of employees [million]:
1988: 17.8
2007: 13,8
2017: 16,5
Increase in housing [million]:
PRL: 10
RP: 3,5
Length of railway lines [thousand km]:
1980: 27
2015: 19
Commercial fleet:
1989: 249 vessels, all under the Polish flag
2016: 96 vessels, including 22 under the Polish flag
Long sea fishing fleet:
1970s: 10th place in the world
2018: full deficiency of top spot
Coal extraction [million t]:
1979: 180 (5th place in the world)
2010: 76 (10th place in the world)
2016: 71 (10th place in the world)
Steel production [million t]:
1988: 17 (13th place in the world)
2009: 9 (19th place in the world)
2017: 10
Sulphur production [million t]:
1989: 4.8 (1st place in the world)
2000: 1.4 (3rd place in the world)
2013: 0.6 (16th place in the world)
Patents applied for:
1989: 5294
2000: 2404
2003: 2268
Patents granted:
1989: 2854
2000: 939
2003: 613
Number of troops:
1988: 112,656 v., 234,3444 p.
2010: 100 412 gr., 0 zas.
Murders per 100,000 inhabitants:
1938: 8,7
1950: 3.6
1959: 2,3
1980: 1.6
1985: 1.8
1990: 1.9
1995: 2.9
2000: 3.3
2005: 2.1
2008: 2.0
Suicides per 100,000 inhabitants
1951: 5.1
1978: 3.6
1981: 3,0
1986: 5.0
1990: 13,0
2008: 14,9
2011: 16.0
2012: 17,0
2017: 13,7
Military arms and equipment exports:
1988: 7.-8th place in the world
2012: 17.-18th place in the world
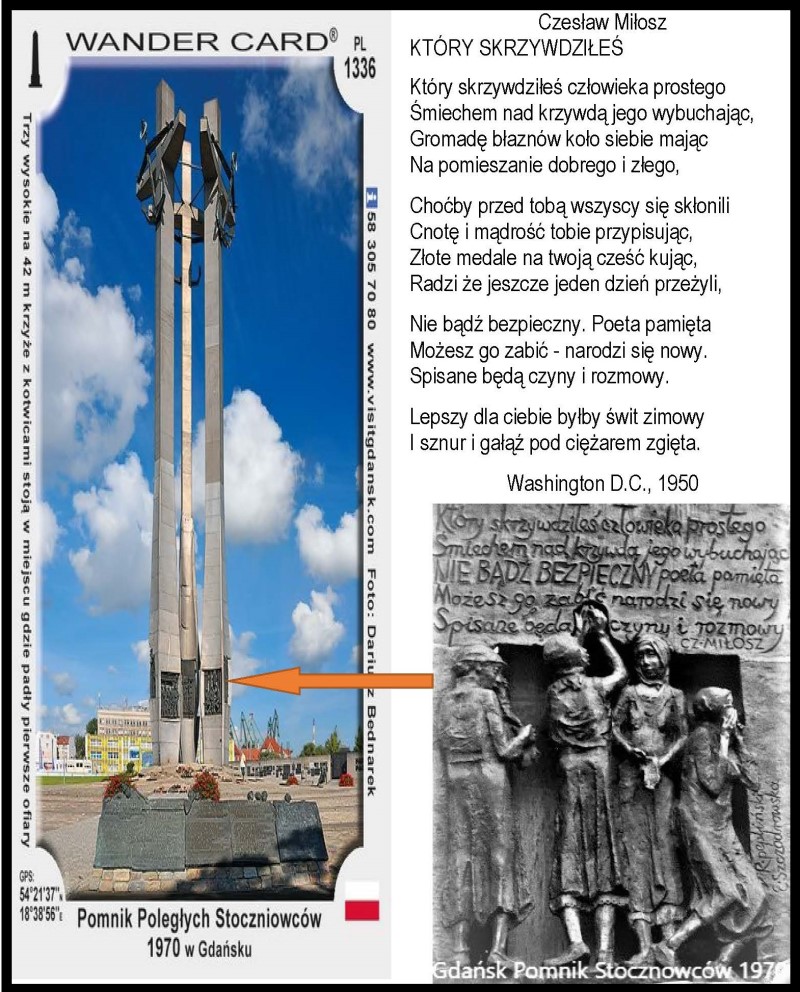
Manufacture of ships:
PRL: the world's foremost
1995: Szczecin Shipyard, 1st place in Europe and 5th in the world, in terms of contract performance
2013: failure of shipbuilding
Production of fishing vessels:
1980: 2nd place (1st Japan)
2015: the failure of industry
According to the ranking where best to be born “The Economist”:
1988: 23rd place
2013: 33rd place
GDP share in the global economy:
1918: approx. 0.9%
1945: ca. 0.8%
1980: approx. 2.4%
2015: approx. 0.6%
Several data besides here: http://www.sadistic.pl/prl-a-iiirp-w-numbers-vt246930.htm
(The first origin was de-graphic, hence the link to rewrite in Sadistic)
The American analytical centers granted Poland the position of 10 of the planet economy.
(source: “Great past of Poland”, Volume 5, Book World, 2003, p. 669)
People's Poland was praised for the deficiency of unemployment by abroad press:
(since 3:19)
Waiting time for an flat in 1987:
14=< years – 10,000.
10-13 years – nearly 36,000 people
7-9 years – 22 000 people
4-6 years – 15,000 people
1-3 years – 11,000 people
>=1 year – 18,000 people
In 1987, cooperatives allocated 112,000 apartments (in 191,4,000 of all fresh apartments).
Average waiting time for an flat in 1987: 6 years.
Average waiting time for an flat in 1980: 5 years.
The full value of property sold by individual governments is:
a) Bielecki's government – PLN 1.5 billion
b) Government of SLD-PSL – PLN 12.8 billion
c) Buzek government (AWS-UW) – PLN 53.8 billion
d) Miller's government – PLN 6.9 billion
e) Government of Belka – PLN 13.8 billion
f) And the government of PiS – PLN 2.5 billion
g) PO government – PLN 54.8 billion
State banks in the III Republic were privatized for 15% of the value.
Foreign capital in 2017 in Poland:
- 50% of manufacture is foreign,
- 65% of the banking sector is foreign,
- 66% of Polish exports are exports of abroad companies.