

Visualizing America’s $19 Trillion Consumer Economy In One Chart
To no one’s surprise, the world’s largest economy is also the world’s largest consumer economy.
But how much do Americans collectively spend on the goods and services they need? And what items draw the largest share?
Visual Capitalist’s Pallavi Rao visualizes data from the Bureau of Labor Statistics for further analysis.
Where Americans Spend Their Money
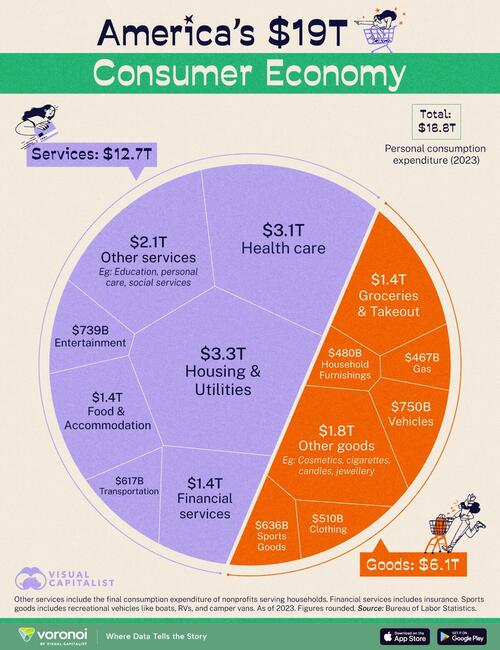
America’s consumer class spent nearly $19 trillion on goods and services in 2023.
For context, this was about 68% of the U.S. GDP that year. It was also larger than China’s overall GDP that year as well ($17.8T).
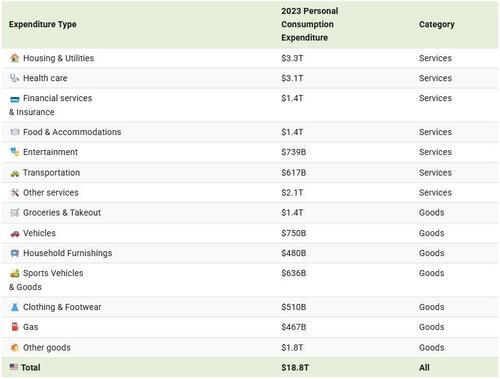
Housing and utilities ($3.3T) and health care ($3.1T) were the top household expenditure categories overall.
Meanwhile, Americans spent the most money on groceries ($1.4T) in the goods category.
In case these numbers seem too big to comprehend, we’ve also broken down household expenditure by year and by month.
Comparative figures may vary as insurance expenditure can sometimes be included within a broader category (housing, transportation), or spun-off on its own.
In a similar vein, another graphic from eight years ago provides some other useful insights: how the share of each category’s expenditure has changed since the 1940s.
While the data isn’t as recent, other trends are visible: health care and housing expenditure have been trending up, clothing and food have been coming down.
The Pros and Cons of the Service Economy
Tellingly, services account for nearly 70% of America’s personal consumption expenditure.
This is matched by the supply side as well: nearly 80% of America’s jobs are in the service sector.
America’s transition away from manufacturing into services—both as producer and consumer—is a story with many episodes and arcs. While it has driven the growth of high-value technology and financial companies, it has also resulted in the loss of blue-collar jobs in America.
This context is particularly relevant in the Trump administration’s second-term.
Broad-based tariffs on imported goods have been declared to reduce trade deficits and to incentivize companies to move their manufacturing back into the country. However, modern manufacturing is built off global supply chains and just-in-time shipping, and economists worry that the disruption will only raise prices for Americans.
Wondering what China’s economy looks like broken down by sector? Check out: China’s $18.6 Trillion Economy in One Chart for a quick overview.
Tyler Durden
Sun, 04/20/2025 – 21:35